- AI, But Simple
- Posts
- An Introduction To Gaussian Process Regression
An Introduction To Gaussian Process Regression
AI, But Simple Issue #60

Hello from the AI, but simple team! If you enjoy our content, consider supporting us so we can keep doing what we do.
Our newsletter is no longer sustainable to run at no cost, so we’re relying on different measures to cover operational expenses. Thanks again for reading!
An Introduction To Gaussian Process Regression
AI, But Simple Issue #60
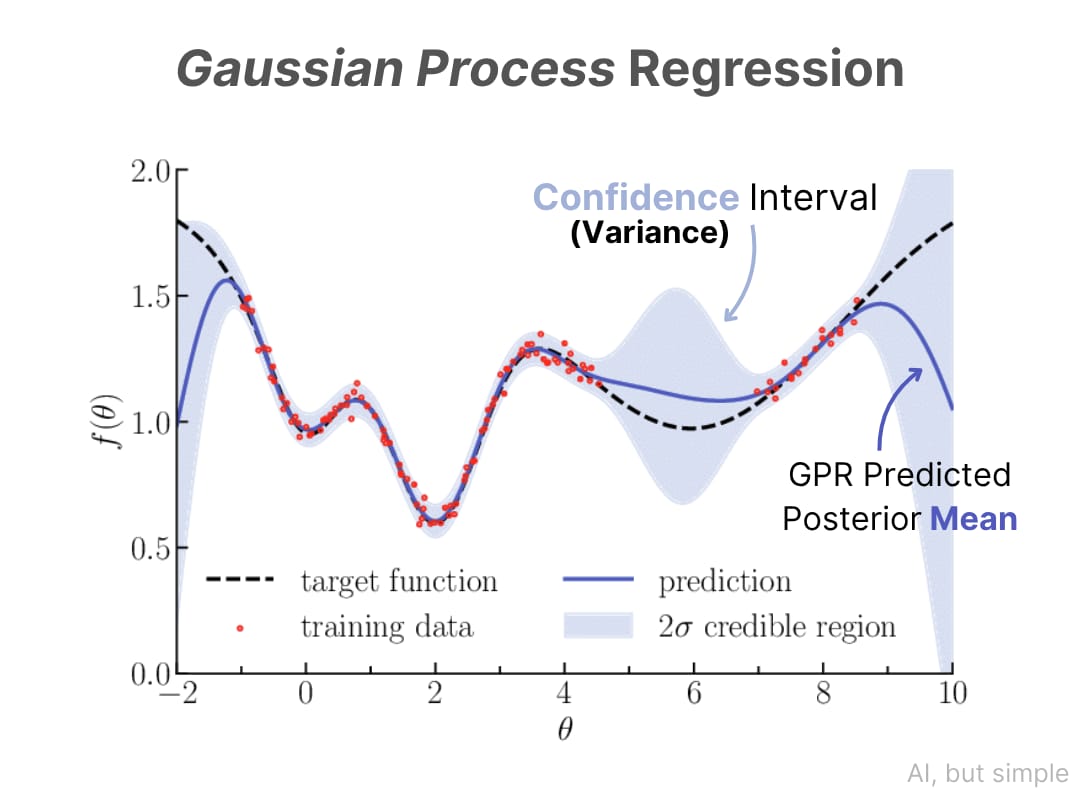
Gaussian Process Regression (GPR) is a method used to make predictions by calculating the probability of the possible outcomes based on observed data.
To understand how and why this approach of probabilistic prediction is so useful, we first need to explore the fundamentals of regression techniques. So, what is a Gaussian (distribution), and how is it used in Gaussian Process Regression?

The Foundation: Statistics
We live in a world where data is extremely important. It significantly influences decision-making across various industries, and understanding or analyzing the data is crucial for processes like machine learning algorithms.
This is where statistics comes in—statistics provides the mathematical framework to extract meaningful insights from large, noisy, incomplete, or complicated datasets.
From predicting stock prices to diagnosing diseases, statistical methods help us explore, analyze, quantify uncertainty, and make informed decisions from our data.
Statistics In Artificial Intelligence
The relationship between statistics and artificial intelligence runs deeper than many people realize.
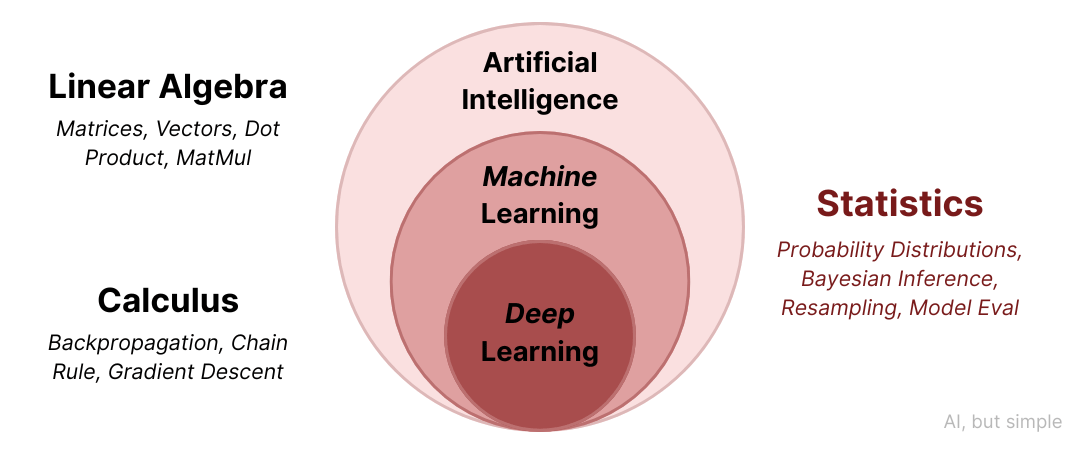
As we know, modern AI algorithms can learn patterns and make predictions about unseen scenarios using calculus and linear algebra.
However, at the foundation of these algorithms, statistical principles also shape AI techniques—from the probability distributions in neural networks to the hypothesis testing in reinforcement learning.

Without statistical foundations, AI would lack the mathematical base needed to handle real-world uncertainty and provide reliable results.
The importance of statistics in AI becomes important, especially when dealing with uncertainty quantification.
Unlike deterministic algorithms that produce single outputs (i.e., point estimates), statistical approaches in AI can additionally express confidence in their predictions, estimate error bounds on the results, and adapt to new information.
These capabilities play a very important role in the successful application of AI in safety-critical areas like healthcare, autonomous vehicles, and financial modeling. Gaussian Process Regression represents one of the most basic methods for supporting such applications.
Understanding the Gaussian Distribution
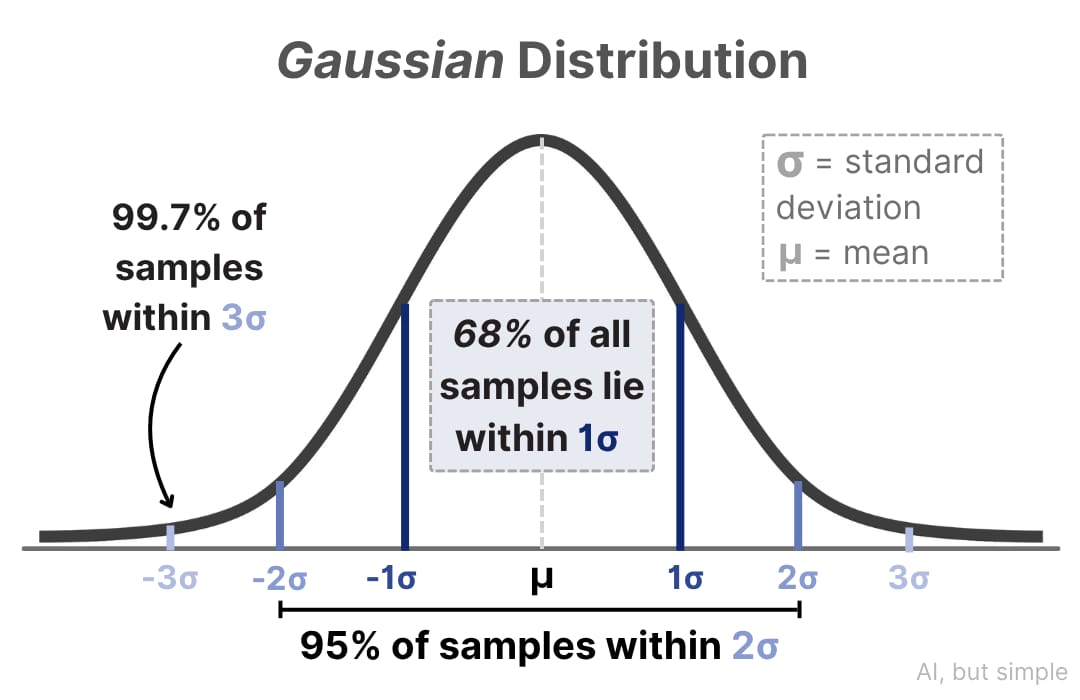
The Gaussian distribution, also known as the normal distribution, is considered as the most important probability distribution in statistics. Named after Carl Friedrich Gauss, it's also commonly referred to as the “bell curve.”

The probability density function (PDF) of a Gaussian is shown above
This “bell-shaped” curve appears throughout nature and in mathematics, making it fundamental to statistical modeling. A common place where you can observe this pattern is the pattern of holes around a dartboard bull’s eye.
Other places where you may have heard of Gaussians include grade curving, where it is believed that students’ grades should follow some distribution close to a bell curve.
Mathematically, the mean (μ) and variance (σ²) or standard deviation (σ) are the most important parameters for a Gaussian distribution, for which the probability density function (PDF) takes this form:

Here, exp represents e, Euler’s number, and the arguments are what goes in the exponent
What makes the Gaussian distribution so special?
First, the Central Limit Theorem, a universal law in statistics, tells us that if you look at the distribution of sample means, this distribution tends to form a Gaussian distribution as long as the sample size is large enough—even if the distribution of the population is not normal.
A sample mean is the average of a set of independent random variables (a sample) taken from a population.
The central limit theorem explains why Gaussian distributions appear so frequently in natural phenomena.